January Update: Explaining Average Billable Rates
...yes, we skipped December. Hopefully you got to take some time off for the holidays and re-calibrated, re-focused, and are re-ally interested in what we've got cooking thus far in 2019.
We've been working on an update that will make projects more useful. Currently, you're only able to set a budget for a project in Ballpark by specifying how many hours the project should take. We then show you the progress of the project as people track time to it, which helps you monitor whether or not you're going to finish it on budget, or go over.
That's fine, but for a long time we've wanted to make those project budgets more robust. We are building our first pass at project budgets in dollars, and figuring out how that works in tandem with hour budgets.
Awhile back, we learned about a really interesting way of calculating profitability of projects from our friends at Summit CPA. Over at Summit, Jody and his team work on the accounting and finances for digital agencies exclusively, and we've learned a lot from his book, Digital Dollars and Cents: A Virtual CFO’s Playbook to help Digital Companies Create a Financial Roadmap to Success. The formula is called Average Billable Rate. In case that term is new to you, here's a little background and an example of how you can use ABR to better understand profitability.
The first step to determining the average billable rate of a project is to calculate the Target Rate; we get there by dividing the dollar budget (what you're going to charge the client for the project) by the hours budget. So, Total Dollar Budget / Hours Budget equals Target Rate. Then we take the actual time tracked to that project, divide that by the total dollar budget, and now we have your average billable rate. The goal of tracking ABR is to get as close to the Target Rate as possible.
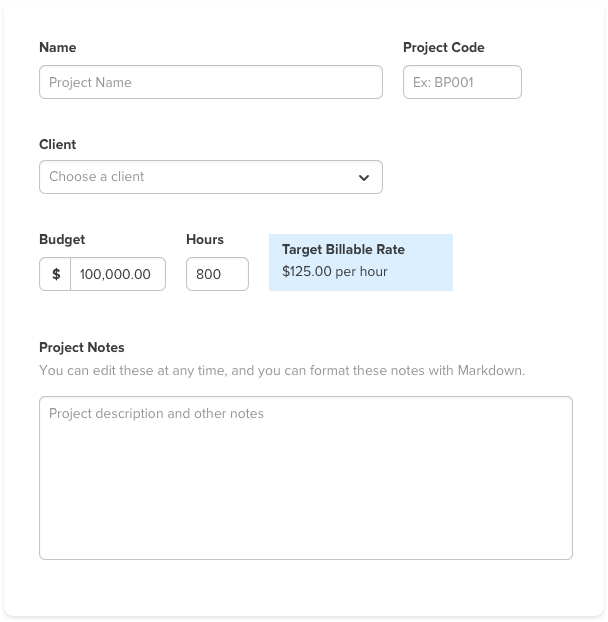
Here's how the target rate is going to look when you're setting up a new project in Ballpark:

Let's walk through an example using nice round numbers. Say you have a project that you sold for $100,000 (nice work!). You typically charge an hourly rate of $125, so you estimate that you've got 800 hours to get it done. You set up the project in Ballpark, entering 800 hours as your hours budget and $100,000.00 as your dollars budget. Ballpark says your Target Rate is $125/hour, which is exactly what you wanted–hooray!
Fast-forward six weeks. Your team has been tracking their time to this project, and you notice the project has just gone over budget by 30 hours. You check your project overview, and you see that your average billable rate has gone down to about $120 (or $120.481927711 to be exact, but that's not a nice, round number like we promised).
Why does that matter? Because now you know that you should have asked for more money, or trimmed scope, or done something differently to hit that targeted hourly rate that you need in order to make the project profitable.
Over time, the learnings you'll get from monitoring your ABR will help you answer questions like:
- Are we charging enough for our services?
- Do we consistently blow our budgets?
- Are certain teams more profitable than others?
- What kind of projects are best for our company?
Tracking ABR is useful for both Time & Materials projects and fixed-fee (or value-based) projects. With T&M projects, you want to try and get as close to the Target Rate as possible. With fixed fee or value-based, your budgeting is for internal use; ABR helps you understand how well your pricing is working as well as speaking to your team's ability to do profitable work.
We're still building this feature, but we would love to know what you think or what questions you have (especially if you do this sort of reporting for your business already). Drop us a line at support@getballpark.com and share your hopes and dreams.
We’ll be back next month with another update.
